Introducing Skedulo CLI Studio, logs and HTTP commands right in the terminal

 Sophie WheelerLead Developer Advocate
If you've ever found yourself flicking between multiple tabs just to debug one triggered action (one for sked tenant, one for the web app, and one for a curl command with a bearer token you copied from somewhere ten minutes ago), this release is for you.
Starting from version 5.1.2, the Skedulo CLI includes CLI Studio, a full-screen, keyboard-driven terminal UI, along with two new command groups: sked logs and sked http. Together they let you switch tenants, browse artifacts, watch execution logs and call the Skedulo API without leaving your terminal, and without ever pasting a token.
In this post I'll walk through what Studio is, what it does, and then show the two new commands with some real examples. Let's start by launching it:
sked
That's it. Once you've installed or updated the CLI (grab the installer from the developer site if you don't have it yet), launch sked with no arguments (or sked interactive if you prefer to be explicit) and Studio opens. Press ? on any screen for that screen's keybindings, and q to get back to your shell.
What's new
There are three big new things in this release, and they're designed to work together:
- CLI Studio: an interactive terminal UI with five screens: tenants, artifacts, logs, an HTTP client and a command browser.
sked logs: fetch, tail and export execution logs for triggered actions, webhooks and functions.sked http: send an authenticated request to any Skedulo API path, curl-style, with the token handled for you.
The nice part is that the Studio screens and the commands share the same code. sked logs tail opens the same log viewer Studio uses. sked http with no URL opens Studio's request builder. So you can pick whichever makes the most sense at that moment. You can use the interactive screen when you're exploring, or the command when you're scripting.
A tour of CLI Studio
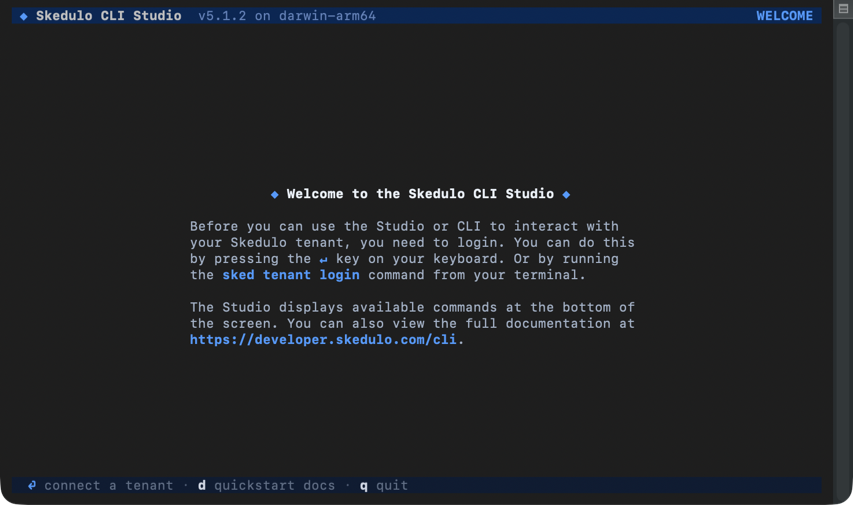
The first time you launch Studio with no stored tenant, you'll see a welcome screen. Press Enter to log in (it's the same guided flow as sked tenant login), d to open the quickstart docs, or q to quit.
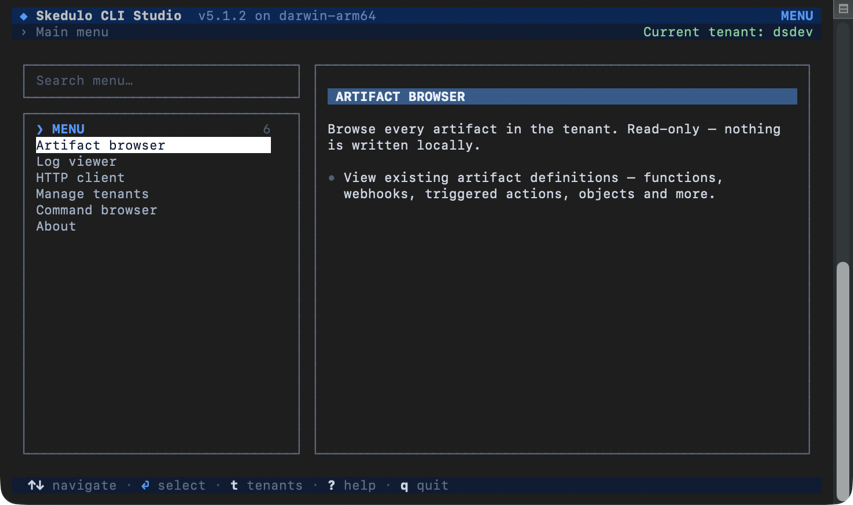
Once you have at least one tenant stored, Studio skips the welcome and opens straight to the menu. Start typing to filter it.
Manage tenants
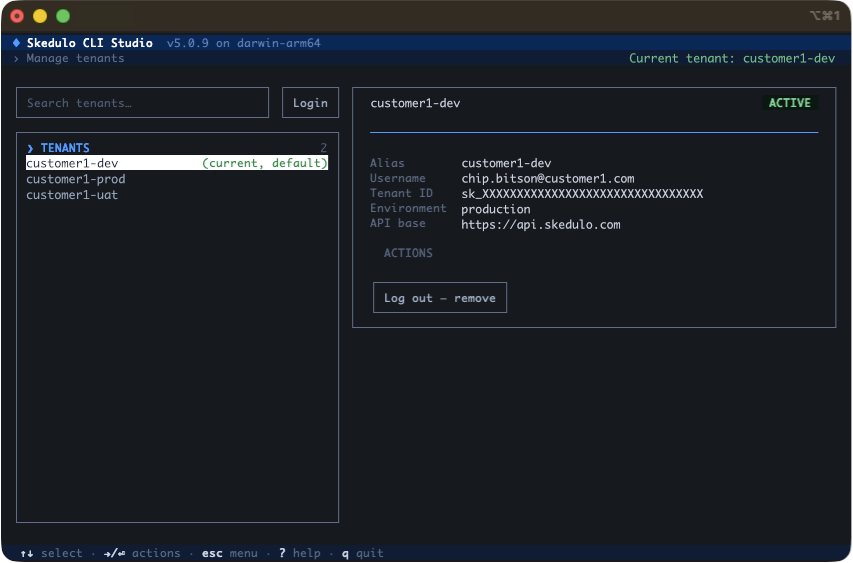
This is where you'll probably start. It lists every stored tenant with its alias, username, tenant ID, environment, API base path and whether the token has expired. From here you can set a tenant as current, make it your default, log out, or log into a new one.
A really useful feature: press t from almost any other screen and you can switch tenants without going back to the menu. If you work across a sandbox and production, or across several customer tenants, that alone saves a lot of sked tenant set-default typing.
Browse artifacts
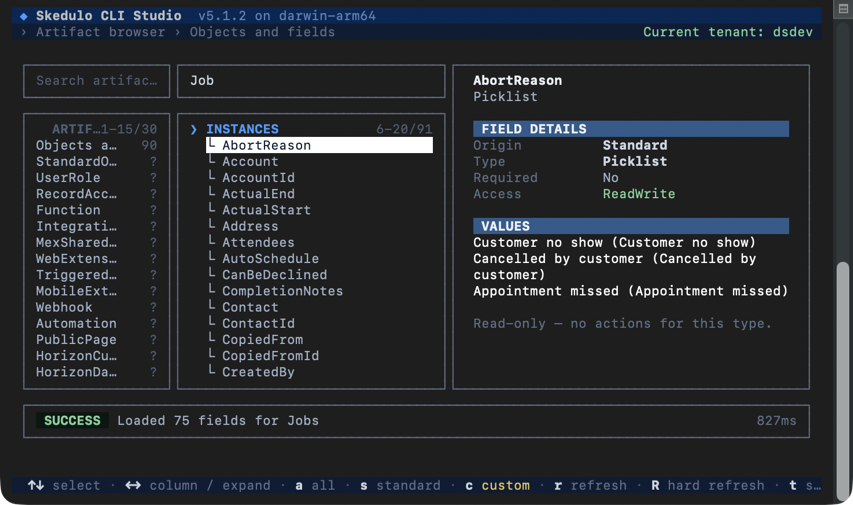
The artifact browser is a three-column layout: artifact and object types on the left, instances of the selected type in the middle, and full field detail on the right.
For object types, you can filter the middle column to all fields, standard fields only, or custom fields only. The detail column splits a record's own fields from its system fields (ID, created, updated), and for object fields it shows schema detail too: origin, type, whether it's required, access mode and picklist values. If you've read my GraphQL introspection post, this is a lot of the same information, without writing a query.
Two context-aware actions show up depending on what you've selected. For webhooks, triggered actions and functions there's View logs, which jumps to the log viewer with that artifact pre-selected. For functions there's also Test endpoint, which opens the HTTP client with the function's URL already filled in.
View logs
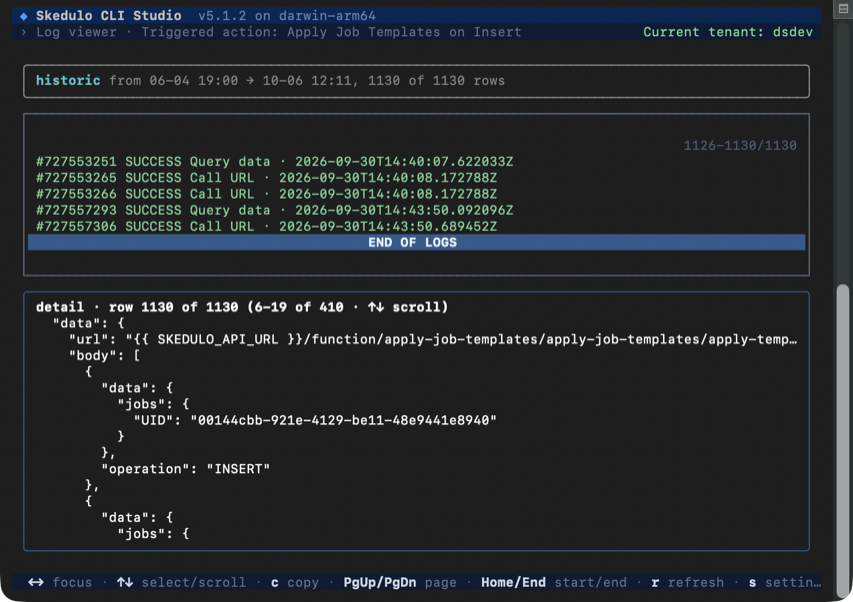
The log viewer shows execution log entries for a triggered action, webhook or function. Entries scroll on one side; full detail for the selected entry is on the other. A status line tells you whether the session is live, paused or historic, and what the poll interval is.
Press space to pause and resume a live session, s to open settings (switch between live and historic, change the poll interval, set a from/to window) and c to copy the selected entry's full detail to your clipboard.
One thing to know: a live session stops polling automatically after 60 minutes. It doesn't kick you out, it just prompts you. Press r to resume. Pausing, resuming or applying new settings resets that timer, so a session you're actively using won't time out on you mid-debug.
HTTP client
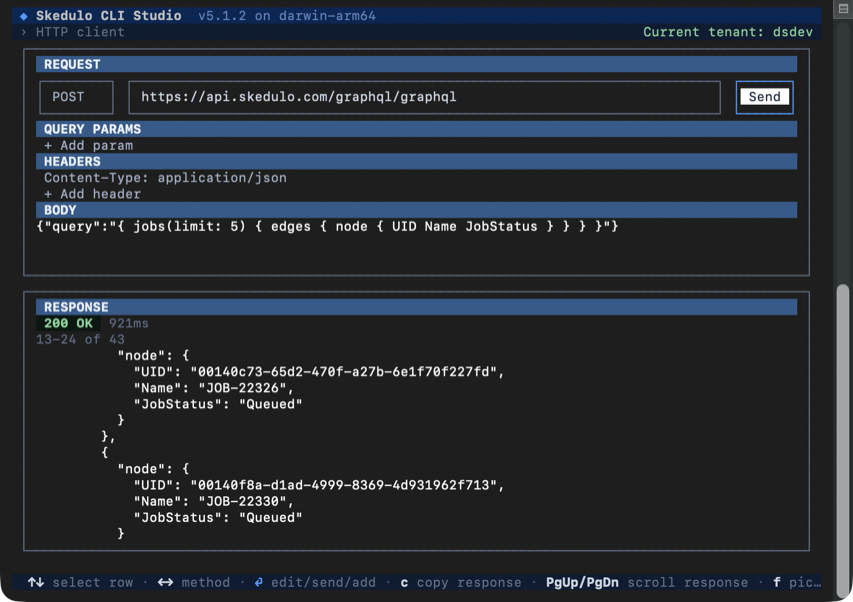
The HTTP client builds and sends a request to the Skedulo API. You get a method and URL field, editable query parameters and headers, and a body field. The response renders underneath with status, duration and body. Arrow keys move the cursor within fields, and c copies the response body.
Because Studio already knows your current tenant, the bearer token is attached for you. No more hunting for a token to paste into Insomnia.
Browse commands
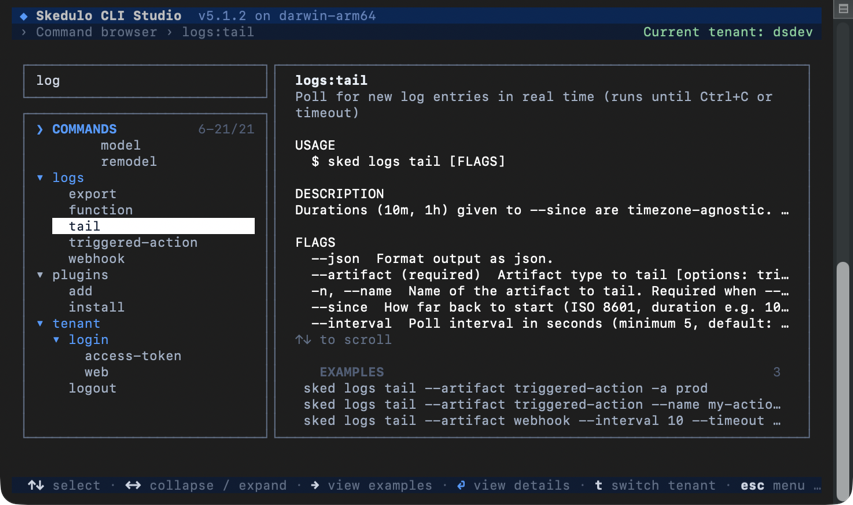
Finally, a searchable tree of every sked command. Select one and you'll see its usage, description, arguments, flags and aliases. Commands with examples list them in their own panel; press c to copy an example, ready to paste into your shell. It's sked --help, but one you can actually navigate.
Note: Studio is designed to be interactive, so it needs a real terminal on both input and output. If you pipe or redirect sked's output, it won't launch, which is the behaviour you want in a script anyway.
sked logs
Until now, checking why a triggered action didn't fire meant opening the web app, finding the artifact, and scrolling. sked logs puts that in the terminal, and more importantly, in your scripts.
There are three fetch commands, one for each artifact type that produces execution logs:
sked logs triggered-action --name job-completed-notify --range last-7-days
sked logs webhook --name salesforce-sync --from 48h --to 24h
sked logs function --name geocode-batch --range today --json
--range takes today, yesterday, last-week, last-7-days or last-30-days. If you need something more precise, --from and --to accept ISO 8601 timestamps or durations like 24h and 7d. Add --order desc to see the newest first, --output ./logs to write to a directory instead of printing, and --json for raw JSON (always UTC, handy for piping into jq).
Tailing a live log
This is the one I'm most excited about. sked logs tail polls for new entries as they happen:
# Tail every triggered action on the current tenant
sked logs tail --artifact triggered-action

# Tail one webhook, starting 30 minutes back, polling every 10 seconds
sked logs tail --artifact webhook --name salesforce-sync --since 30m --interval 10

# Functions need a name
sked logs tail --artifact function --name geocode-batch
In a terminal this opens the same interactive viewer as Studio's log screen. An entry that changes status (say, from processing to success) updates in place rather than being appended again, so you can watch a run go through its lifecycle.
If you'd rather have plain, append-only lines (for a CI log, or to grep through), add --raw or pipe the output. Both paths honour --timeout, which defaults to 60 minutes.
Exporting in bulk
sked logs export writes logs for every artifact of a type to a directory, one file per artifact:
sked logs export --artifact triggered-action --output ./export --range last-7-days
sked logs export --artifact webhook --output ./export --filterByName salesforce-sync,zendesk-sync --yes
It shows you a confirmation table of what it's about to export before it starts (--yes skips that for scripts), writes an export-summary_<timestamp>.json alongside the files with per-artifact results, and splits any file that reaches 1 GB. If one artifact fails, it still writes the rest and exits with code 1 so your pipeline knows.
sked http
If you've ever needed to hit GraphQL or another Skedulo API, you've probably gone through the pain of setting it all up and then going off to get a token. sked http makes this much easier. Give it a path, and it resolves against your current tenant's API and attaches your saved access token:
sked http /graphql/graphql -H "Content-Type: application/json" \
  -d '{"query":"{ jobs(limit: 5) { edges { node { UID Name JobStatus } } } }"}'
The flags will feel familiar if you use curl. -X sets the method (it defaults to POST when you pass -d, otherwise GET), -H adds a header and is repeatable, -d is the body, -o writes the response to a file, and -v prints the outgoing request with the Authorization header masked. There's also -f to exit non-zero on a 4xx or 5xx, and --json to get a structured { status, statusText, headers, durationMs, body } object back.
One gotcha, same as curl: a JSON body needs an explicit -H "Content-Type: application/json". It isn't set for you, and most Skedulo REST endpoints will reject an unparseable body without it.
A few more examples:
# Geocode an address
sked http /geoservices/geocode -H "Content-Type: application/json" \
  -d '{"addresses":["47 Warner Street, Fortitude Valley QLD, Australia"]}'

# Fetch the tenant's GraphQL schema straight to a file
sked http /graphql/schema -o schema.graphql

# Hit a different tenant without switching your default
sked http /graphql/schema -a sandbox -o sandbox-schema.graphql

# Open the interactive request builder instead
sked http
That last one opens Studio's HTTP client, so you can build the request up interactively and then copy the response out.
On token safety
sked http is designed so that a relative path always goes to your current tenant's API with the token attached. However, an absolute URL only gets the token if its origin matches your tenant's API base path. Any other host is called without one.
Additionally, any 3xx redirect is shown rather than followed, so a request body can't be silently resent to a host you didn't intend.
This means you can point sked http at a third-party endpoint without worrying about leaking a Skedulo token.
Putting it together
Enough talk about the new features alone, let's put them into practice.
Debugging a triggered action that isn't firing
You get a report that job completions aren't sending the follow-up SMS. With the new logs feature, you can start a tail on the action, then trigger it:
sked logs tail --artifact triggered-action --name job-completed-notify --since 5m
In another tab, complete a job (or send the mutation yourself):
sked http /graphql/graphql -H "Content-Type: application/json" \
  -d '{"query":"mutation { schema { updateJobs(input: { UID: \"<job-uid>\", JobStatus: \"Complete\" }) } }"}'
The entry appears in the tail, you can see the statuses, and the detail pane shows the payload and any error. Now you know where to start debugging, simply press c to copy it if you need to raise a support ticket.
Checking a function before you ship
You've deployed a new version of a function and want to smoke-test it. Open Studio, go to Browse artifacts, select the function, and choose Test endpoint. The HTTP client opens with the function's URL filled in (functions deployed with the CLI live at /function/<name>/<name>, since each is its own package); add a body, send, and read the response. Then press t to switch to the next tenant and do it again.
If you'd rather script it, the same call is one line, and -f makes it fail the build on a bad status:
sked http /function/geocode-batch/geocode-batch -H "Content-Type: application/json" \
  -d '{"addresses":["1 George St, Brisbane"]}' -f
Keeping a weekly log archive
Some teams need webhook history retained longer than the platform keeps it, or want it in their own log tooling. You can use the logs export command to achieve this.
sked logs export --artifact webhook --output ./archive/$(date +%F) \
  --range last-7-days --yes
Pulling a schema for codegen
If you generate types from the GraphQL schema (I covered why in Part 4), this can replace the curl-with-a-token step in your build:
sked http /graphql/schema -o schema.graphql
Get it
If all of this sounds great and you want to try it yourself, all you need to do is grab the installer for your platform from the Skedulo CLI page on the developer site. Once it's installed, open a fresh terminal and launch Studio:
sked about   # check your version, needs to be 5.1.2 or later
sked
If this is your first time with the CLI, the install guide gets you from zero to a logged-in tenant in a few minutes, and the Studio docs cover every keybinding.
As always, we'd love to hear what you're building and what you'd like to see in Studio next. Reach out on LinkedIn or raise a ticket with developer support.
References
Related posts

Introducing the new Skedulo developer site!
developer.skedulo.com is live: quickstarts, browser-based API explorers, the developer blog, a changelog, and agent-ready docs, now in one place.
Read the post
Skedulo Fall ‘24 Developer Roundup
Learn about the latest developer features as part of our Fall '24 Launch
Read the post
Developer Docs: June round-up
Learn about the latest updates and additions to the Skedulo Developer Guides, including API documentation, selecting pages, feedback form, and more.
Read the post